Macro United States
US Private Credit Under Significant Stress
Redemption Gates and Hidden Data Center Debt
Bull, Bear, Bust · 4 October 2026 · 18 min read
Dear Client,
The private credit landscape in the U.S. is showing significant stress, with two interwoven fault lines — redemption suspensions and off-balance-sheet data center debt — creating a complex risk picture. While a full market collapse is not the base case, the structural vulnerabilities are real and growing.
KEY POINTS A quick-read snapshot of this newsletter's commentary
▸ Private credit in the U.S. is showing significant stress, with two interwoven fault lines — redemption suspensions and off-balance-sheet data center debt — creating a complex risk picture. ▸ Redemption gates are already being triggered across the largest private credit funds, including Blackstone BCRED, Blue Owl, Apollo Debt Solutions, Cliffwater and BlackRock HLEND, and roughly $14 billion is trapped across the sector heading into H2 2026. ▸ The contagion is spreading to Australia, where Metrics Credit Partners froze $9 billion in funds and Perpetual Ltd. suspended redemptions entirely. ▸ The five major hyperscalers carry $1.65 trillion in off-balance-sheet obligations, more than their entire disclosed debt load of $1.35 trillion, and this hidden debt has grown eightfold in four years. ▸ CCC spreads crossed 1,000 bps on September 30, the first time since the March 2023 regional banking crisis, and the average public BDC now trades at 0.75× price-to-NAV. ▸ The base case remains a contained correction (10-15%), not a collapse, and a systemic collapse (more than 25%) carries a 5-10% probability. ▸ The systemic scenario requires a cluster of failures — a major hyperscaler credit event, simultaneous private credit fund failures, bank contagion and policy paralysis — none of which are currently signaled. ▸ The critical uncertainty is whether AI revenue materializes fast enough to service the hidden obligations before the refinancing walls hit in 2027–2028. |
The Private Credit Redemption Crisis Is Already Here
This is not a theoretical risk — redemption gates are being triggered across the largest private credit funds right now:
Fund — Redemption Requests — Action Taken
- Blackstone BCRED: ~10% of shares in Q2 — Capped at 5% quarterly limit
- Blue Owl (flagship fund): 38% of shares outstanding — $4.7B in combined requests; capped
- Apollo Debt Solutions BDC: 16.8% of shares — Capped at 5%
- Cliffwater: 17% of shares — Lowered repurchase limit from 7% to 5%
- BlackRock HLEND: 13.3% of shares (Q1) — Gated for second consecutive quarter Globally, roughly $14 billion is trapped across the private credit sector heading into H2 2026. In Australia, Metrics Credit Partners froze $9 billion in funds, and Perpetual Ltd. suspended redemptions entirely — the contagion is spreading across geographies.
The structural problem: These vehicles lend into illiquid, long-duration loans while offering periodic liquidity to investors. Blackstone's own analysis acknowledges this: "liquidity is available until enough investors request it at the same time". Morgan Stanley projects direct-lending defaults could climb to 8% — more than triple the historical average. Man Group put the industry default rate at 5.8% at midyear, with problematic payment-in-kind interest rising to 6.4% from 2.5% at end-2021.
J.P. Morgan's Q4 2026 heatmap confirms the macro backdrop: the leveraged-credit distressed universe has expanded to $218 billion, the highest since mid-2023, with the U.S. leveraged-loan default rate at 3.04% rising toward a 4.5% 2027 forecast and loan recoveries at a record low of ~36 cents on the dollar.
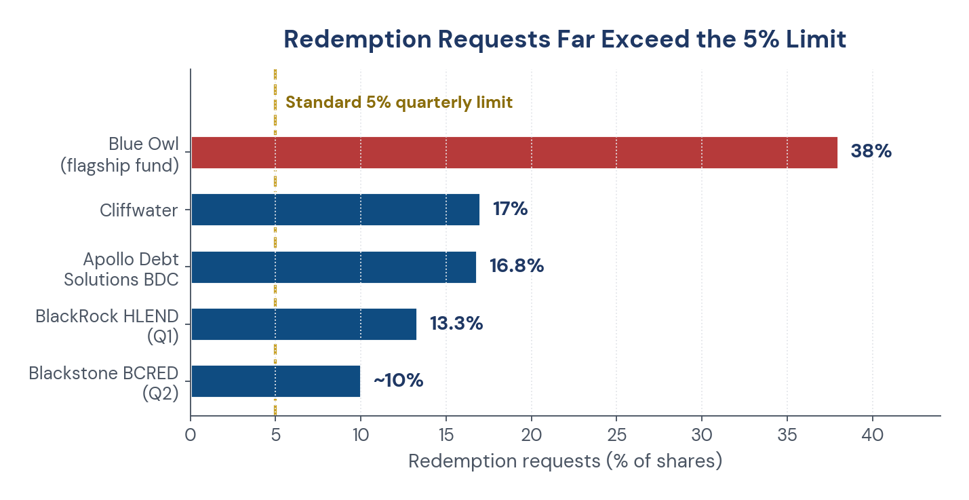
Figure 1. Redemption requests at the largest private credit funds against the standard 5% quarterly repurchase limit.
The Off-Balance-Sheet Data Center Debt Is the Hidden Amplifier
This is the dimension that transforms a contained private credit correction into a potential systemic event.
The Scale of Hidden Obligations
Nikkei Asia's investigation combing through financial statement footnotes reveals that the five major hyperscalers — Alphabet, Microsoft, Amazon, Meta, and Oracle — carry $1.65 trillion in off-balance-sheet obligations, which is more than their entire disclosed debt load of $1.35 trillion. This hidden debt has grown eightfold in four years, tracking the AI capex race almost exactly.
Meta is the starkest case: its off-balance-sheet obligations total roughly $420 billion — nearly triple its reported debt — much of it tied to a joint-venture structure with Blue Owl Capital financing a mega data center in Louisiana, where Meta holds a minority equity stake and leases back capacity long-term rather than owning it.
Oracle's hidden liabilities have grown roughly thirtyfold in four years, heavily linked to build-out commitments underpinning OpenAI's compute needs, with about $260 billion in future lease commitments that will eventually land on its books.
Moody's separately quantified $662 billion in future data-center lease commitments across the same five companies — equivalent to 113% of the group's adjusted on-balance-sheet debt.
Why This Structure Exists — and Why It's Dangerous
The mechanism is rational at the micro level: AI hardware becomes technologically obsolete in 18 to 36 months, but data centers have traditionally been financed on 10-to-15-year leases. To make the economics work, leases are written with short initial terms backstopped by guarantees that don't register as liabilities upfront.
The critical risk: Standard leverage ratios are structurally blind to this growing share of the risk. GPU purchase agreements, data center leases signed for facilities that haven't opened yet, and joint ventures with private credit funds all create real, contractually binding future cash obligations — but under current GAAP accounting rules, none count as debt until the underlying facility "commences".
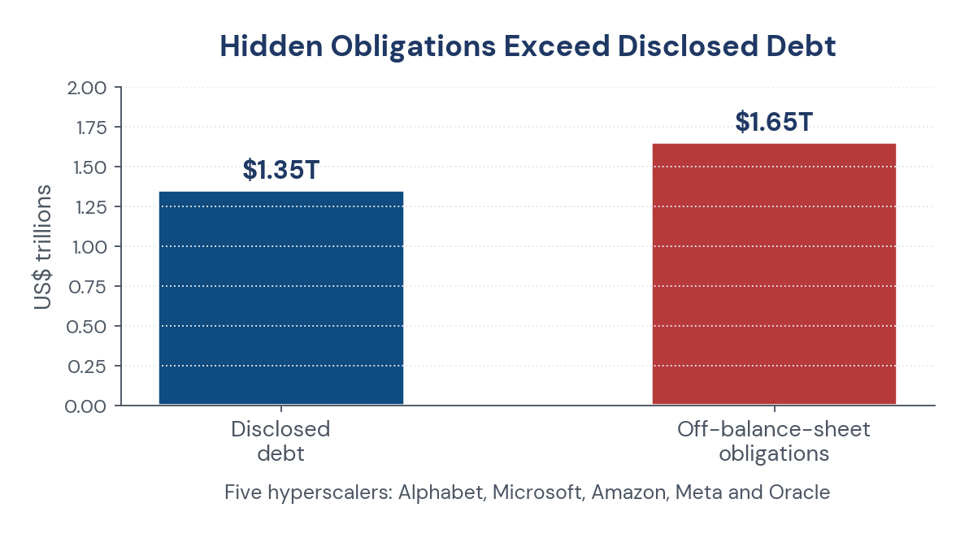
Figure 2. Hyperscaler off-balance-sheet obligations against disclosed debt (Nikkei Asia).
How These Two Fault Lines Interlock
The BIS warned in March 2026 that "shadow borrowing" in the AI buildout is strengthening links between hyperscalers and non-bank investors — insurers and private credit funds are increasingly exposed to hyperscaler credit risk through these off-balance-sheet structures.
This creates a circular funding dependency:
AI revenue disappoints → Hyperscaler credit costs rise → New leases and capex are cut → Data center valuations and refinancing capacity decline → Private credit and insurance capital suffers losses → Banks and other funding providers tighten credit → The internal financing loop contracts in reverse
Bank of America's May 2026 fund manager survey found that 34% of global fund managers now cite AI hyperscaler capital spending as the most likely source of a future systemic credit event — double the share from April. US private credit remains the top concern for 42% of respondents.
The ECB has explicitly flagged this: if private credit continues to grow rapidly as a source of funding for AI companies and data centres, investors could be left exposed to losses from disappointment in the technology's potential. The ECB's Financial Stability Review found that euro area financial institutions have limited direct exposure, but insurance corporations and pension funds could face material second-round revaluation losses from spillovers to leveraged loans, high-yield bonds, and equities.
Could This Trigger a Market Collapse? — Scenario Assessment
MSCI's June 2026 scenario analysis constructed two stress scenarios sharing a stagflationary backdrop but differing in origin. Both produce roughly 11% portfolio losses — but through different channels:
Scenario — Transmission Channel — Portfolio Impact
- Private-credit contagion: Rising redemptions → fund leverage stress → forced selling of liquid public bonds → spreads widen — Driven by private credit and high yield
- Hyperscaler credit repricing: Public IG market reassesses tech credit risk → financing tightens for private borrowers — Driven by equities and investment-grade bonds Key insight from MSCI: For allocators, identifying which channel dominates matters more than the headline loss.
Probability-Weighted Assessment
Scenario — Probability (6-12 months) — Trigger Conditions
- Contained correction (10-15%): 30-40% — Redemption gates spread further; hyperscaler earnings disappoint modestly; credit spreads widen to 350-400 bps
- Broader credit event (15-25% decline): 15-20% — Multiple large funds gate simultaneously; AI capex guidance cut materially; HY spreads >500 bps; layoffs accelerate
- Systemic collapse (>25% decline): 5-10% — Requires: (1) major hyperscaler credit event, (2) simultaneous failure of 2+ large private credit funds, (3) bank exposure contagion, (4) policy paralysis
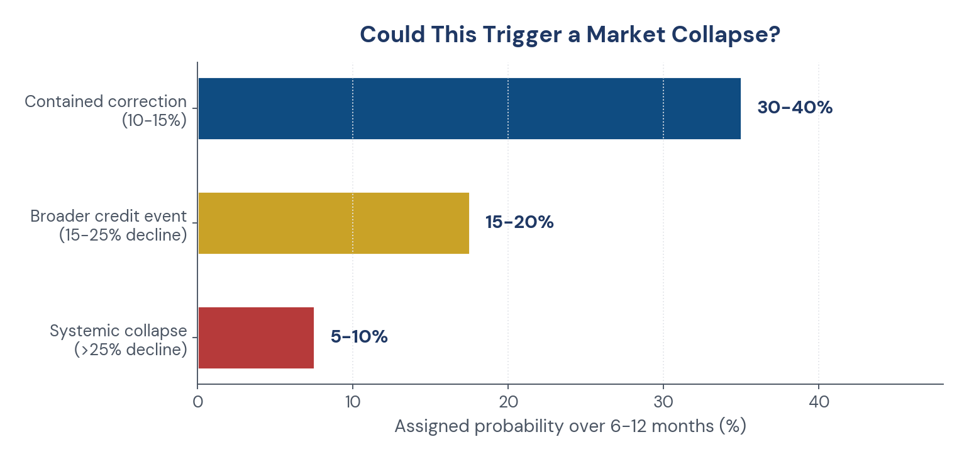
Figure 3. Probability-weighted market-collapse scenarios, 6-12 months.
The State Street assessment is instructive: despite late-cycle risks including high rates, inflation, and private credit growth, "strong bank capitalization, stress testing, and moderate private debt suggest volatility ahead, not systemic collapse". The ECB similarly concludes it is "unlikely that private credit in isolation could be a source of systemic financial instability at present" — but emphasizes that insurance and pension fund second-round effects could be material.
What to Watch — The Key Triggers
Indicator — Current Status — Alert Threshold
- Redemption gate announcements: Spreading (Blackstone, Blue Owl, Apollo, BlackRock) — 3+ new gates in a single month
- Hyperscaler capex guidance: Still rising — Any material cut in 2027 capex plans
- HY credit spreads: ~294 bps — >400 bps
- CCC spreads: 968-1,128 bps — Sustained >1,200 bps
- Leveraged loan default rate: 3.04% — >4.5% (JPM 2027 forecast)
- Loan recoveries: ~36 cents — Below 30 cents
- BDC discount to NAV: Widening — Sustained >20% discount
- Data center vacancy rates: Tight — Rising vacancy = overbuild signal
- AI revenue vs. capex gap: Widening — Hyperscaler AI revenue < 50% of capex
Bottom Line
The private credit market is already in a stress regime — redemption gates are not hypothetical; they are happening across the largest funds. The off-balance-sheet data center debt adds a hidden leverage layer that traditional risk models do not capture, and the BIS, ECB, and major banks have all flagged it as an emerging systemic concern. However, the base case remains a contained correction (10-15%), not a collapse. The systemic scenario requires a cluster of failures — a major hyperscaler credit event, simultaneous private credit fund failures, and bank contagion — none of which are currently signaled. The critical uncertainty is whether AI revenue materializes fast enough to service the $1.65 trillion in hidden obligations before the refinancing walls hit in 2027-2028.
Part 2
PRIVATE CREDIT STRESS DASHBOARD
Integrated with Fab Five Framework | As of October 3, 2026
I. CRISIS STATE OVERVIEW
Dimension — Status — Severity
- Redemption Gates: Active across 6+ major funds; spreading to Australia — Critical
- BDC Discounts to NAV: Average 0.75×; 70%+ below 0.80× — Critical
- CCC Spreads: 1,007 bps — first >1,000 since 2023 banking crisis — Critical
- HY Spreads: 294 bps — highest since April — Elevated
- Leveraged Loan Defaults: 3.04%, recovery ~36 cents — Elevated
- Hyperscaler Off-BS Debt: $1.65T (Nikkei) to $3.1T (Morgan Stanley) — Structural
- AI Revenue vs. Capex Gap: ~$1 trillion (Stanford); $300B breakeven gap (Goldman) — Widening
- VIX: 16.39 — Complacent
- 10-Yr Treasury: ~5.23–5.26% — Elevated
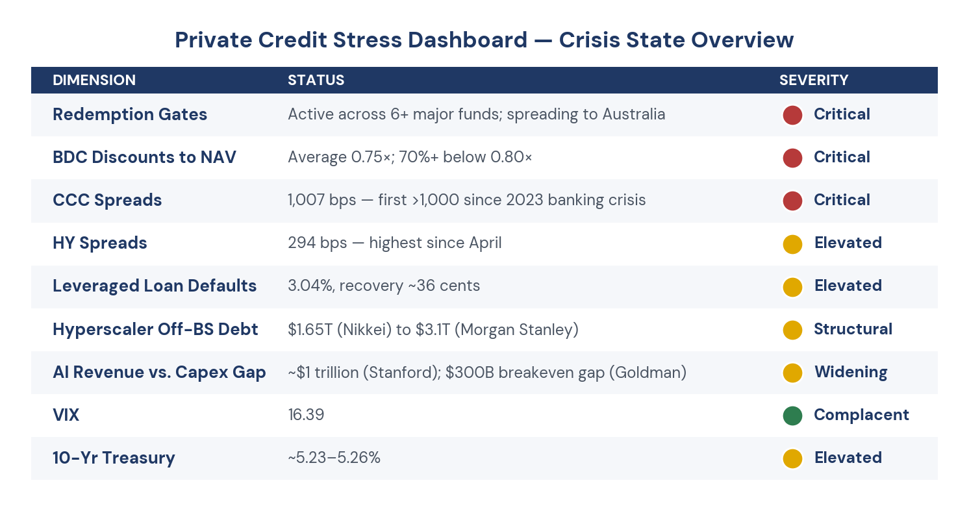
Figure 4. The private credit stress dashboard: crisis state overview by severity.
II. PRIVATE CREDIT REDEMPTION & LIQUIDITY STRESS
A. Active Redemption Gates
Fund — Manager — Redemption Requests — Action Taken
- Blackstone BCRED: Blackstone — ~10% of NAV — Capped at 5% quarterly limit
- Cliffwater Corporate Lending: Cliffwater — 17% of shares (up from 14% Q1) — Repurchased only 5%; rest prorated
- Blue Owl Flagship: Blue Owl — 38% of shares ($4.7B combined) — Gated
- Apollo Debt Solutions: Apollo — ~16.8% of shares — Capped at 5%
- BlackRock HLEND: BlackRock — 13.3% of shares (Q1) — Gated for second consecutive quarter
- Metrics Credit Partners: Perpetual Ltd. — Suspended unit redemptions — Australian contagion Fitch data: Redemption requests across 16 non-traded BDCs reached an average 10.3% of shares outstanding in Q2, up from 9.7% in Q1 — versus the standard 5% quarterly repurchase limit.
B. BDC Discounts to NAV — A Market Pricing Crisis
The average public BDC now trades at 0.75× price-to-NAV, down from 0.84× at end-2025 and 0.87× in January. More than 70% of BDCs trade below 0.80× NAV, up from 50% at end-2025 and just 28% a year earlier. Deepest discounts include Investcorp (0.22×), Prospect Capital (0.36×), and OFS Capital (0.41×).
Cox Capital Partners launched tender offers for Apollo, HPS, and Ares BDC shares at 15%–30% discounts to May-end NAV — offering 70, 75, and 85 cents on the dollar respectively.
C. The Negative Feedback Loop
"It's a negative feedback loop. People get nervous and sell, and so therefore people get nervous and sell." — Dugald Higgins, Zenith Investment Partners
Semi-liquid vehicles promise periodic liquidity against illiquid, long-duration private loans. When redemption requests spike, gates trigger, which signals distress to other investors, which accelerates further redemptions. Approximately $14 billion is trapped across the sector heading into H2 2026.
One mitigating signal: Blue Owl's flagship fund withdrawal requests have begun to slow, suggesting the acute phase may be easing. But the structural liquidity mismatch remains unresolved.
III. OFF-BALANCE-SHEET DATA CENTER DEBT
A. Scale of Hidden Obligations
Source — Estimate — Scope
- Nikkei Asia: $1.65 trillion — 5 hyperscalers (Alphabet, Microsoft, Amazon, Meta, Oracle)
- Morgan Stanley: $3.1 trillion — 7 hyperscalers + chipmakers
- FT Analysis: $300 billion in guarantees issued in past 12 months alone — Residual value guarantees The $1.65 trillion in off-balance-sheet obligations exceeds the $1.35 trillion these companies report as debt — and has grown roughly eightfold in four years.
B. Three Mechanisms of Hidden Debt
-
Long-term data center lease commitments — Operating leases reported in footnotes, not as balance sheet debt. A hyperscaler leases a data center built to spec rather than financing it directly.
-
GPU take-or-pay contracts — Binding commitments to pay for set volumes of chips whether used or not. Not loans, so not booked as debt.
-
Joint venture / SPV financing — Hyperscaler partners with private credit or PE to create a special-purpose vehicle that borrows and builds. The debt sits on the SPV's books, not the hyperscaler's.
Meta's exposure: ~$420 billion in off-balance-sheet obligations — nearly triple its reported debt — much of it tied to a Blue Owl Capital JV financing a Louisiana mega data center.
C. The Guarantee Layer
Big Tech is increasingly using residual value guarantees — commitments to cover shortfalls if assets (chips, data centers) lose value. These are described by bankers as "balance-sheet efficient" because they backstop debt issued by SPVs rather than the tech companies themselves.
"There has been a significant expansion in off-balance-sheet exposure over the past year. That adds a very high degree of complexity to their credit risk profiles." — Doug Colandrea, KBRA
IV. THE AI REVENUE VS. CAPEX GAP
A. The Numbers
Metric — Estimate — Source
- AI capex 2026: ~$1.0 trillion — UBS
- AI capex 2027: ~$1.45 trillion — UBS
- Cumulative 2026–2028: ~$4.1 trillion — UBS
- Hyperscaler AI revenue to break even: ~$300 billion annually — Goldman Sachs
- Actual AI revenue (annualized, Q2 2026): ~$70 billion above pre-AI trend — Goldman Sachs The gap: Stanford economists Jared Bernstein and Ryan Cummings found a nearly $1 trillion gap between hyperscaler spending and AI revenue since 2024. They estimate companies would need to triple or quadruple AI revenue next year and every year for the next decade to justify spending.
Goldman Sachs separately found hyperscaler AI revenues remain below what they need just to break even on capex — despite cloud revenue accelerating from 25% growth in 2024 to 48% in Q2 2026.
B. The Depreciation Time Bomb
A major chunk of hyperscaler spending is on chips that lose value after approximately five years. But data centers are financed on 10–15 year leases. This mismatch means the assets backing the debt may be obsolete before the debt is repaid.
Goldman's capex growth deceleration forecast:
- 2026: ~100% growth
- 2027: 54% growth
- 2028: 12% growth This deceleration is already priced into the curve — but if it comes faster than expected, the SPV/lease financing structures become unrefinanceable.
V. CREDIT MARKET STRESS INDICATORS
A. Spread Levels
Indicator — Current — Alert Threshold — Status
- HY OAS: 294 bps — >350–400 bps — Approaching
- CCC OAS: 1,007 bps — >1,000 bps — Breached
- IG OAS: ~80 bps — >150 bps — Contained
- Leveraged Loan Default Rate: 3.04% — >4.5% (JPM 2027) — Rising
- Loan Recoveries: ~36 cents — <30 cents — Deteriorating
- Distressed Universe: $218 billion — >$250B — Highest since mid-2023 CCC debt crossed 1,000 bps on September 30 — the first time since the March 2023 regional banking crisis. The spread has widened 147 bps since early September (from 860 bps), signaling sharply rising default expectations for the lowest-quality corporate borrowers.
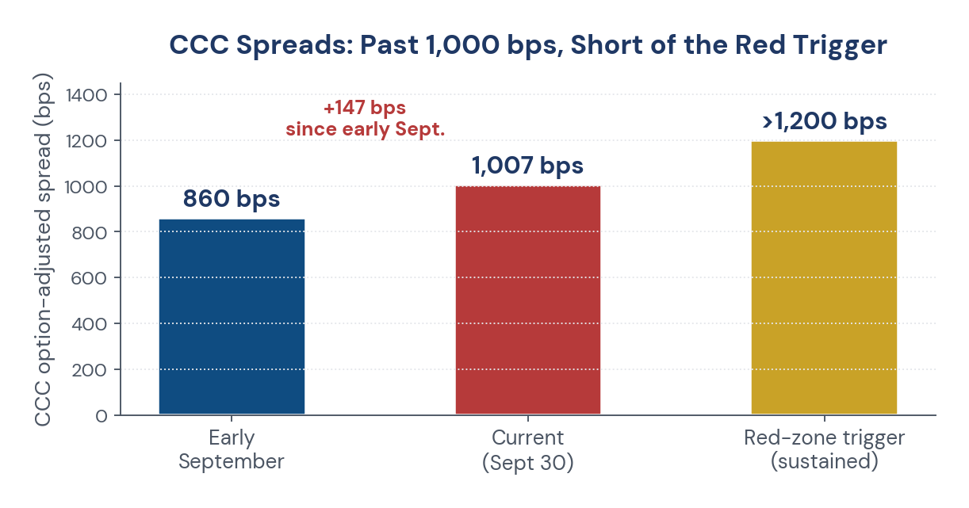
Figure 5. CCC spreads: past the 1,000 bps level, short of the 1,200 bps trigger.
High-yield bond yields hit 8.03% — the largest 5-week surge in 17 years — as a supply deluge (including SoftBank's $10B issuance and Paramount's $44.4B offering) overwhelmed investor demand.
B. MSCI Writedown Data
MSCI reports that more than one-tenth of private credit fund loans have been marked down by at least 50% — the highest level since the immediate aftermath of COVID-19. The rate of senior loan writedowns has tripled since 2022.
C. MSCI Contagion Scenario Analysis
MSCI constructed two stress scenarios sharing a stagflationary backdrop:
Scenario — Transmission Channel — Portfolio Loss
- Private-credit contagion: Redemptions → fund leverage stress → forced selling → spreads widen — ~11%; North American private credit loses 9% directly, with loan/HY spread widening contributing two-thirds
- Hyperscaler credit repricing: Public IG market reassesses tech credit → financing tightens for private borrowers — ~11%; driven by equities and IG bonds Key insight: "For allocators, identifying which channel dominates matters more than the headline loss".
VI. FAB FIVE INTEGRATION
Fab Five Component — Pre-Crisis Read — Private Credit Impact — Revised Read
- Trend: Bullish — S&P 500 holds uptrend, but breadth collapse undermines conviction — Neutral/Bullish
- Breadth: Bearish (49% above 200-DMA; equal-weight on 7-week losing streak) — Private credit gates confirm internal rot; HO clusters active — Bearish
- Momentum: Neutral — HY yield surge + CCC spread blowout = momentum deterioration — Bearish
- Sentiment: Bearish/Neutral (AAII bearish 48.1%) — Redemption panic adds to defensive positioning — Contrarian Bullish
- Monetary: Neutral (Fed on hold, 10-Yr at 5.26%) — Credit stress may force Fed's hand; rate cuts become more likely — Neutral Net Fab Five Signal: The private credit crisis confirms and amplifies the breadth weakness identified in the original Fab Five analysis. The "Yellow-Light Bull" regime has shifted toward "Yellow-Light with Credit Flashing Red." Trend remains the last bullish pillar standing, but it is increasingly isolated.
VII. TRAFFIC LIGHT ALERT SYSTEM
GREEN — Low Risk (0–5% crash probability)
- HY spreads < 250 bps
- CCC spreads < 700 bps
- No new redemption gates for 30+ days
- BDC average discount > 0.90× NAV
- McClellan Summation Index rising
- Hyperscaler capex guidance stable/rising
YELLOW — Elevated Watch (15–30% crash probability)
- HY spreads 250–350 bps — CURRENT: 294 bps
- CCC spreads 700–1,000 bps — CURRENT: 1,007 bps
- 1–2 new redemption gates per month — CURRENT: Multiple
- BDC average discount 0.75–0.90× — CURRENT: 0.75×
- McClellan Oscillator negative — CURRENT: Negative since mid-August
- Hyperscaler capex guidance unchanged — CURRENT: Stable
RED — High Risk (40%+ crash probability)
- HY spreads > 400 bps
- CCC spreads > 1,200 bps
- 3+ new redemption gates in a single month
- BDC average discount < 0.70×
- McClellan Summation Index turns negative
- Major hyperscaler cuts 2027 capex guidance
- S&P 500 breaks below 200-DMA (7,677) Current State: YELLOW with RED elements in credit markets. CCC spreads and BDC discounts are already at RED-adjacent levels; the broader HY market and equity trend have not yet confirmed.
VIII. PROBABILITY-WEIGHTED CRASH SCENARIOS
Scenario — Probability (6–12 months) — Trigger Conditions — S&P 500 Impact
- Contained correction: 35–45% — Redemption gates stabilize; hyperscaler earnings modestly disappoint; HY spreads widen to 350–400 bps — –10% to –15%
- Broader credit event: 15–20% — Multiple large funds gate simultaneously; AI capex guidance cut materially; HY spreads > 500 bps; layoffs accelerate — –15% to –25%
- Systemic collapse: 5–10% — Major hyperscaler credit event; simultaneous failure of 2+ large private credit funds; bank exposure contagion; policy paralysis — > –25% MSCI's scenario analysis puts both the private-credit contagion and hyperscaler repricing paths at roughly 11% portfolio losses — meaningful but not catastrophic. The systemic scenario requires a cluster of failures that none of the leading indicators currently signal.
ECB assessment: "Euro area financial institutions appear to have limited direct exposure to private credit. This makes it unlikely that private credit in isolation could be a source of systemic financial instability at present." However, insurance corporations and pension funds could face material second-round revaluation losses from spillovers to leveraged loans, high-yield bonds, and equities.
IX. WEEKLY MONITORING CHECKLIST
Credit Stress
- HY OAS level (alert: >350 bps)
- CCC OAS level (alert: >1,200 bps)
- New redemption gate announcements
- BDC discount to NAV (alert: <0.70×)
- Leveraged loan default rate (alert: >4.5%)
- Loan recovery rates (alert: <30 cents)
Data Center / AI Debt
- Hyperscaler capex guidance changes
- Hyperscaler CDS spreads (Oracle at ~200 bps — the stress outlier)
- Data center vacancy rates (rising = overbuild)
- AI revenue vs. capex gap trajectory
- New SPV/JV financing announcements
- Residual value guarantee disclosures
Market Technicals
- S&P 500 vs. 200-DMA (7,677)
- McClellan Summation Index (alert: cross below 0)
- Hindenburg Omen cluster count
- Equal-weight vs. cap-weight divergence
- VIX (alert: sustained >25)
Macro / Policy
- Fed language on credit conditions
- ISM PMI (alert: <50 for 3 months)
- 10-Yr Treasury yield (alert: sustained >5.50%)
- Investment-grade issuance calendar (supply deluge risk)
X. BOTTOM LINE
The private credit market is already in a stress regime — redemption gates are not hypothetical; they are happening across Blackstone, BlackRock, Apollo, Cliffwater, Blue Owl, and now Australian funds. The off-balance-sheet data center debt (3.1T) adds a hidden leverage layer that traditional risk models do not capture, and the AI revenue vs. capex gap (~$1 trillion) represents the fundamental uncertainty that could force a repricing.
However, the base case remains a contained correction (10–15%), not a collapse. The systemic scenario requires a cluster of failures — a major hyperscaler credit event, simultaneous private credit fund failures, and bank contagion — none of which are currently signaled. The critical uncertainty is whether AI revenue materializes fast enough to service the hidden obligations before the refinancing walls hit in 2027–2028.
The Fab Five framework now reads: Trend (last bullish pillar) + Breadth (bearish) + Momentum (deteriorating) + Sentiment (contrarian bullish) + Monetary (neutral, but rate cuts increasingly likely). This is a fragile bull — not yet a bear, but the margin of safety is thin and narrowing.
What would flip to RED: CCC spreads sustained >1,200 bps, HY spreads >500 bps, McClellan Summation Index negative, S&P 500 below 200-DMA, and a major hyperscaler cutting 2027 capex guidance — all simultaneously.
What would flip back to GREEN: Redemption gates stabilizing for 60+ days, BDC discounts recovering above 0.90×, HY spreads tightening below 250 bps, and AI revenue growth accelerating toward the breakeven trajectory.
Sincerely,
Bull Bear Bust
DISCLAIMER This newsletter is published for informational and educational purposes only. Nothing contained herein constitutes investment advice, a solicitation, or a recommendation to buy or sell any financial instrument. All investment involves risk, including the loss of principal. Past commentary does not guarantee future results. Any views expressed are those of the author as of the date of publication and are subject to change without notice. Please consult a licensed financial advisor before making any investment decisions. |