Macro United States
US Market Outlook Report
A Fragile Bull Regime
Bull, Bear, Bust · 3 October 2026 · 9 min read
Dear Client,
Summary: The S&P 500 closed at 7,719.59 on 2026-10-03, with a forward P/E of 19.4 — its lowest since April 2025 despite the index trading near all-time highs. This creates a rare "rising index, falling valuation" dynamic driven by earnings growth outpacing price appreciation. However, a stark breadth divergence persists: only 49% of S&P 500 stocks trade above their 200-day moving average, down from ~75% during the summer, and roughly 60% of constituents are already in bear market territory (down ≥20% from their own highs). The probability-weighted roadmap below assigns 55-60% likelihood to continued grinding gains over 6 months, with a 10-12% correction as the most probable risk event, and a full crash (>20%) probability of 10-15%.
KEY POINTS A quick-read snapshot of this newsletter's commentary
▸ The S&P 500 enters Q4 2026 in a "fragile bull" regime: earnings-driven valuation compression, a contained Fed, and defensive retail sentiment acting as contrarian fuel. ▸ Forward P/E has compressed to 19.4×, the lowest since April 2025, even as the index trades near all-time highs — a rare "rising index, falling valuation" dynamic. ▸ Breadth is the critical weakness: only 49% of S&P 500 stocks trade above their 200-day moving average, down from ~75% in summer 2026, and roughly 60% of constituents are already in bear market territory. ▸ The roadmap assigns 45-55% probability to a sustained bull advance over six months, with a 10-15% corrective consolidation as the next most likely outcome. ▸ A 10-12% correction is the single most probable risk event; a full crash (>20%) carries a 10-15% probability. ▸ High-yield credit spreads sit at 294 bps — the level that would flip the outlook bearish is above 350-400 bps. ▸ The bull case rests on three pillars: earnings growth materializing, breadth broadening, and credit markets staying orderly. If two of three fail together, the correction probability jumps to 50%+. ▸ The most probable path is grinding gains with periodic 8-12% corrections, not an imminent crash — a crash scenario requires a credit event or earnings collapse, neither currently signaled. |
1. Market Snapshot (as of 2026-10-03)
Metric — Current — Context
- S&P 500 Level: 7,719.59 — Near ATH; bounced off 2026 uptrend line at 7,617
- Forward P/E: 19.4× — Lowest since April 2025; below 5-yr avg of 19.9×
- 10-Yr Treasury Yield: ~5.26-5.34% — Highest since 2002; retreated from 5.34% peak
- VIX: ~14.87 — Subdued, well below stress threshold of 20
- AAII Bearish Sentiment: 48.1% — Fifteen points above long-term avg of 31.5%
- HY Credit Spreads: ~294 bps — Highest since April; CCC spreads at 968-1,128 bps
- McClellan Oscillator: Negative since mid-August — Persistent negative breadth momentum
- Q3 2026 Earnings Growth (est.): +23-30% YoY — 8th straight quarter of double-digit growth
2. Five-Dimension Current Read
2.1 Valuation — Neutral (Slightly Supportive)
The S&P 500's forward P/E has compressed to 19.4× even as the index approaches record levels. This is the direct result of earnings growing faster than prices: Nvidia, Amazon, and Alphabet have all become cheaper on a forward basis, with Nvidia trading at 24.4× forward earnings despite being up 21.9% YTD. The index has returned ~13.1% YTD with a falling multiple, which is historically unusual and suggests the rally is earnings-driven rather than purely speculative.
Key nuance: 19.4× is below the 5-year average of 19.9× but still above the 10-year average of 19.0×. The de-rating from ~23× in October 2025 to ~19× represents significant compression, but the absolute level is not "cheap" by historical standards.
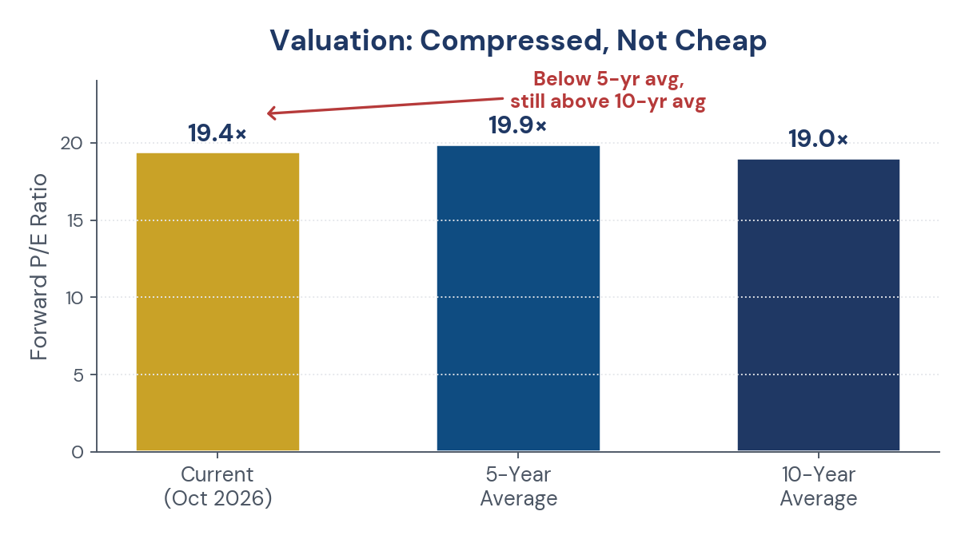
Figure 1. Forward P/E today against the 5-year and 10-year averages — compressed, but not cheap.
2.2 Technical / Trend — Bullish, With Caveats
The index holds its March-to-October uptrend line at 7,617, which has served as reliable support. The Investing.com technical summary shows strong buy across 11 of 12 moving averages (MA5 through MA200) and 9 of 10 technical indicators. RSI at 57.14 is neutral, MACD above zero, and the 50-day MA sits at ~7,651 as immediate support.
Immediate levels:
- Resistance: 7,750-7,780 (prior swing area), then 7,816 (mid-August peak/new record zone)
- Support: 7,617 (uptrend line), 7,595, then 7,474
2.3 Breadth — Bearish (The Critical Weakness)
This is the most concerning dimension and the primary reason the Fab Five framework is not uniformly bullish.
- Only 49% of S&P 500 stocks trade above their 200-day MA, down from ~75% in summer 2026
- 75% of S&P 500 constituents trade below their 50-day MA despite the index near ATHs
- The equal-weight S&P 500 may post its 7th consecutive weekly decline — longest streak since the 2002 dot-com bust and matching the 2022 bear market
- NYSE 52-week new lows have outnumbered new highs for 12 consecutive days, with 17 of the past 18 days showing this pattern — a configuration similar to 2022 bear market conditions
- The McClellan Oscillator has been negative since mid-August, and the NYSE McClellan Summation Index has broken below the March 2026 low
- Russell 3000: ~51% of stocks are down ≥20% since June — technically in bear market territory
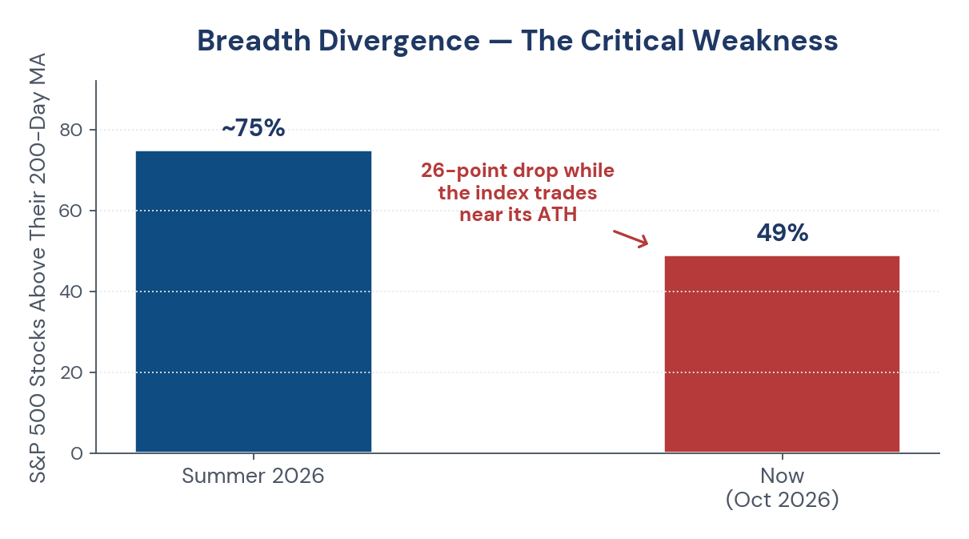
Figure 2. The breadth divergence — stocks above their 200-day moving average, summer 2026 versus now.
2.4 Sentiment — Contrarian Bullish (Defensive Positioning as Fuel)
The sentiment picture is unusually bifurcated:
- AAII bearish sentiment at 48.1% vs. bullish at 32.7% — a spread well beyond the long-term average bearish reading of 31.5%
- Goldman Sachs Panic Index below 1, and the bank's equity positioning sentiment gauge at -0.9 — matching the March 2026 market low reading
- VIX at 14.87 — conspicuously low relative to the bearish equity sentiment, suggesting institutional hedging is more muted than retail fear implies
- Put/call ratio at 0.71 — leaning bullish (call-heavy) Interpretation: The combination of high retail bearishness + low institutional panic + subdued VIX creates a constructive contrarian backdrop. However, sentiment alone is not a buy signal — it needs breadth stabilization to confirm.
2.5 Macro & Monetary — Neutral, With Inflation Pressure
- ISM Manufacturing PMI at 54.5 (9th consecutive month of expansion); S&P Global US Manufacturing PMI at 55.9 — 4-year high
- ISM Prices Index surged from 71.1 to 77.9 — near levels seen during the US-Iraq war, reflecting tariff, metal cost, and energy supply pressures
- Non-farm payrolls +84K (vs. +162K prior), unemployment at 4.1%
- Fed on hold at 3.75-4.00%; October hike probability dropped from 68.6% to 24.9% after multiple Fed officials signaled no urgency
- 10-year Treasury yield at ~5.26-5.34%, with long-term yields pressured by oil prices, fiscal concerns, and AI/data-center capital demand
- High-yield spreads widened 12 bps to 294 bps, highest since April; CCC spreads at 968-1,128 bps
3. Probability-Weighted Roadmap
1-Month Outlook (October 2026)
Scenario — Probability — Key Drivers
- Grind higher (to 7,780-7,820): 40-45% — Earnings beats, yields stabilize below 5.2%, breadth begins to stabilize
- Choppy sideways (7,617-7,780): 30-35% — Mixed earnings, yield volatility, breadth neither improves nor deteriorates
- Shallow pullback (to 7,595-7,617): 15-20% — Yield spike above 5.4%, weak earnings guidance, breadth worsens further
- Deeper correction (<7,595): 5-10% — Credit spreads blow out, negative earnings surprise from mega-caps Key watch items: Q3 earnings season (beginning mid-October), 10-year Treasury yield trajectory, McClellan Oscillator reversal.
3-Month Outlook (Q4 2026)
Scenario — Probability — Description
- Continued advance (7,800-8,000+): 35-40% — Breadth broadens, earnings confirm AI-driven growth thesis, Fed signals no hike
- Sideways / rotational: 30-35% — Index range-bound, sector rotation continues, leadership narrows further
- 10-15% correction (to ~6,600-6,950): 15-20% — Breadth breaks down decisively, credit spreads widen past 350 bps, yields spike above 5.5%
- Major bear breakdown (>20%): 5-10% — Requires credit crisis + breadth collapse + earnings recession Historical analog: In years when the S&P 500 was up 10-20% after nine months, the fourth quarter was higher 21 out of 24 times since 1928, with the three down years losing only 1%.
6-Month Outlook (Q4 2026 - Q1 2027)
Scenario — Probability — Description
- Sustained bull advance: 45-55% — Mid-cycle expansion persists, breadth eventually broadens, AI capex cycle supports earnings
- Corrective consolidation (10-15% drawdown): 25-30% — Narrow leadership finally breaks, but no systemic credit event
- Full bear market (>20% decline): 10-15% — Multiple failures: credit spreads widen sharply + trend breaks + earnings disappoint
- Sharp V-recovery after correction: 10-15% — Fast drop followed by swift rebound as sentiment resets Historical support for bull case: Since 1938, the 12 months following a midterm election have seen the S&P 500 higher 95% of the time. RBC notes that the five rate-tightening cycles since 1994 saw the S&P 500 drop between 8% and 14% — corrections, not crashes.
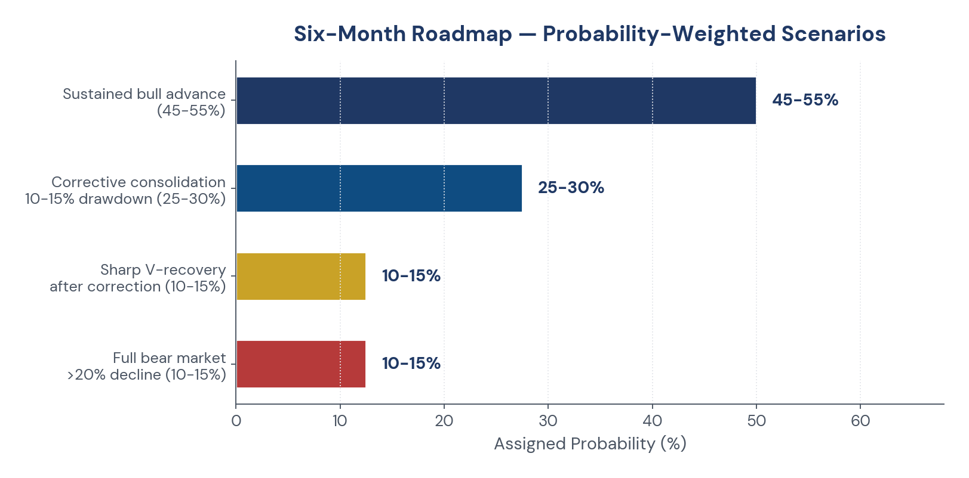
Figure 3. The six-month roadmap — probability-weighted scenarios.
4. What Flips the Outlook Bearish
The roadmap above assumes breadth does not deteriorate further. A shift to a high-crash-risk state requires a cluster of the following triggers:
Trigger — Current Status — Alert Threshold
- McClellan Summation Index: Positive long-term, but weakening — Cross below zero
- 200-day MA break: S&P 500 above — Decisive break below 7,677
- HY credit spreads: 294 bps — >350-400 bps
- CCC spreads: 968-1,128 bps — Sustained >1,200 bps
- 10-Yr yield: ~5.26% — Sustained >5.50%
- Earnings revisions: Positive (+23-30% Q3 est.) — Turn negative
- Fed policy: On hold, hike odds ~25% — Surprise hike + hawkish guidance
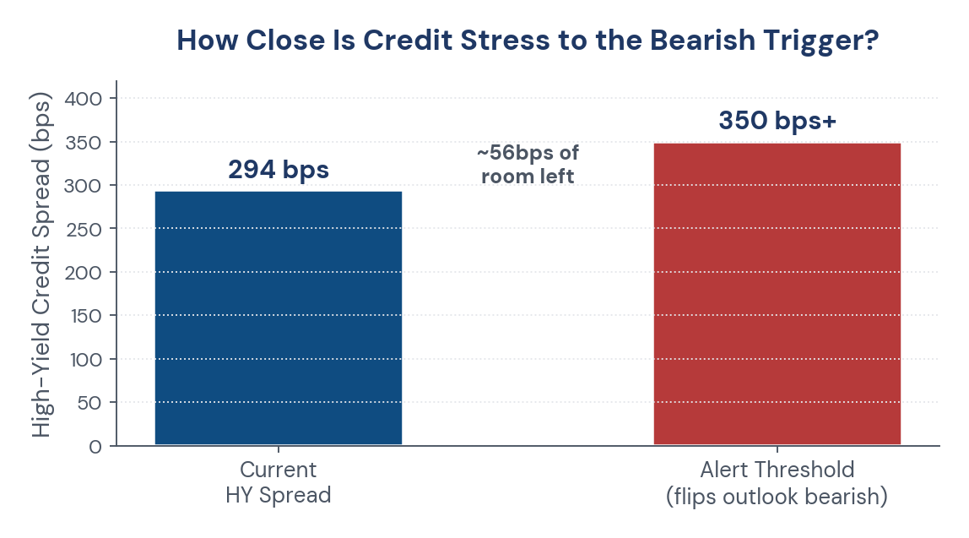
Figure 4. How close credit stress sits to the threshold that would flip the outlook bearish.
Jeffrey Gundlach's warning captures the risk concisely: the S&P 500's surface calm masks "massive internal rot" — like a tree that looks solid but is hollow inside, waiting to snap.
5. What Invalidates the Bullish Roadmap
The bull case rests on three pillars:
- Earnings growth materializes — Q3 estimates at +23-30% YoY must be met or beaten
- Breadth eventually broadens — the 49% above 200-day MA needs to stabilize and improve, not deteriorate further
- Credit markets remain orderly — HY spreads stay below 350 bps; no systemic credit event If two of these three fail simultaneously, the 6-month correction probability rises from ~25-30% to 50%+.
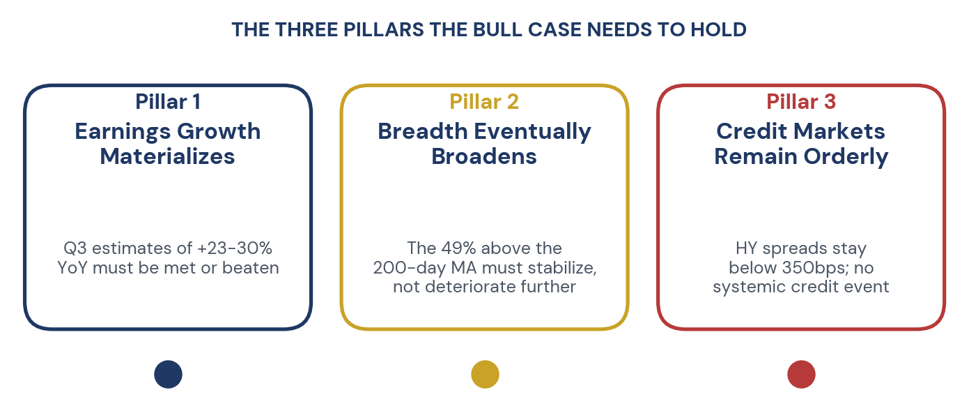 Figure 5. The three pillars the bull case needs to hold.
Bottom Line
The S&P 500 enters Q4 2026 in a "fragile bull" regime: the index is supported by earnings-driven valuation compression, a contained Fed, and defensive retail sentiment acting as contrarian fuel. But the breadth collapse — 60% of stocks in bear market territory, equal-weight index on its longest losing streak since 2002, and negative McClellan momentum — represents a structural vulnerability. The most probable path is grinding gains with periodic 8-12% corrections, not an imminent crash. The crash scenario requires a credit event or earnings collapse to materialize, neither of which is currently signaled by leading indicators.
Sincerely,
Bull Bear Bust
DISCLAIMER This newsletter is published for informational and educational purposes only. Nothing contained herein constitutes investment advice, a solicitation, or a recommendation to buy or sell any financial instrument. All investment involves risk, including the loss of principal. Past commentary does not guarantee future results. Any views expressed are those of the author as of the date of publication and are subject to change without notice. Please consult a licensed financial advisor before making any investment decisions. |